MIMO for Event History#
[1]:
import numpy as np
import mdof
import quakeio
from mdof import modal, transform
from mdof.utilities import Config, extract_channels, print_modes
Data inputs#
[2]:
# PAINTER RIO DELL TRANSVERSE (CASE 1)
station_id = 'CE89324'
chan_config_direction = 'Transverse'
[3]:
directory = f"uploads/{station_id}/"
pattern  = "????????*.[zZ][iI][pP]"
from pathlib import Path
files = [file for file in Path(directory).glob(pattern)]
[4]:
from uploads.channel_conf import CHANNEL_CONF
chan_conf = CHANNEL_CONF[station_id][chan_config_direction]
chan_conf
[4]:
{'inputs': [3, 17, 20], 'outputs': [7, 9, 4]}
Method Inputs#
General Parameters#
parameter |
value |
|---|---|
|
number of output channels |
|
number of input channels |
|
number of timesteps |
|
timestep |
|
decimation (downsampling) factor |
|
model order (2 times number of DOF) |
Observer Kalman Identification (OKID)#
parameter |
value |
|---|---|
|
number of Markov parameters to compute (at most = nt) |
Eigensystem Realization Algorithm (ERA)#
parameter |
value |
|---|---|
|
number of observability parameters, or prediction horizon |
|
number of controllability parameters |
System Realization with Information Matrix (SRIM)#
parameter |
value |
|---|---|
|
number of steps used for identification, or prediction horizon |
Parameters for Mode Validation#
parameter |
value |
|---|---|
|
number of steps used for temporal consistency in EMAC |
[5]:
# Set Parameters
conf = Config()
conf.m  = 500
conf.horizon = 190
conf.nc = 190
conf.order  = 12
conf.a  = 0
conf.b  = 0
conf.l  = 10
conf.g  = 3
conf.period_band = (0.1,0.6)
conf.damping = 0.06
conf.pseudo = True
conf.outlook = 190
# conf.ss_decimation = 8
[6]:
event_modes = []
from matplotlib import pyplot as plt

methods = ["okid-era", "srim"]
lstyles = ["dashed", "dashdot", "dotted"]
colors = ["purple", "orange", "black"]
realizations = {}
summary_table = {}

for i, file in enumerate(files[:2]):
    fig, ax = plt.subplots(figsize=(8,4))
    print(file)
    try:
        event = quakeio.read(file, exclusions=["*filter*"])#, "*date*"])
        peak_accel = np.abs(event['peak_accel']*0.0010197162129779)
        event_date = event['event_date']
        print("peak acceleration (cm/s/s):", peak_accel)
        print("event date/time:", event_date)
        inputs, dt = extract_channels(event, chan_conf['inputs'])
        outpts, dt = extract_channels(event, chan_conf['outputs'])
        summary_table[event_date] = {"peak acc": np.round((peak_accel),3)}
        for method in methods:
            realizations[method] = mdof.system(method=method, inputs=inputs, outputs=outpts, threads=8, chunk=200, **conf)
    except Exception as e:
        print(e)
        print(">>>>> Not read: ", file.name)
        continue
    for j,method in enumerate(methods):
        print(method)
        ss_modes = modal.system_modes(realizations[method],dt,**conf)
        ss_periods = [1/value["freq"] for value in ss_modes.values() if value["energy_condensed_emaco"]>0.5 and value["mpc"]>0.5]
        ax.vlines(ss_periods, 0, 1, linestyles=lstyles[j], color=colors[j], linewidth=2, label=f"{method.upper()}")# if i==0 else None)
        summary_table[event_date][method] = np.round(np.max(ss_periods),3) if len(ss_periods)>0 else np.nan
        print_modes(ss_modes)
    periods, amplitudes = transform.fourier_transfer(inputs=inputs[0], outputs=outpts[0], step=dt, **conf)
    amplitudes = amplitudes/max(amplitudes)
    summary_table[event_date]['FSTF'] = np.round(modal.spectrum_modes(periods, amplitudes, prominence=0.1)[0][0],3)
    ax.plot(periods, amplitudes, label="FSTF", color="blue")
    periods, amplitudes = transform.response_transfer(inputs=inputs[0], outputs=outpts[0], step=dt, periods=periods, threads=8, **conf)
    amplitudes = amplitudes/max(amplitudes)
    summary_table[event_date]['RSTF'] = np.round(modal.spectrum_modes(periods, amplitudes, prominence=0.1)[0][0],3) if len(modal.spectrum_modes(periods, amplitudes)[0]) > 0 else np.nan
    ax.plot(periods, amplitudes, label="RSTF", color="green")
    ax.set_xlim(conf.period_band)
    ax.set_title(f"Date/Time: {event_date}, Peak acceleration: {np.round(peak_accel,2)} g")
    ax.set_xlabel("Period (s)")
    ax.set_ylabel("Normalized Amplitude")
    if i==1:
        ax.legend(loc='upper right', frameon=True, framealpha=0.5)
uploads/CE89324/riodell_14sep2012_71842075_ce89324p.zip
peak acceleration (cm/s/s): 0.22396333100497512
event date/time: 2012-09-14T11:53:00
okid-era
Spectral quantities:
       T(s)        ζ        EMACO      MPC       EMACO*MPC
      0.2841     -0.04477   0.0        0.9921     0.0
      0.1753     -0.01744   0.0        0.8405     0.0
      0.1236     -0.01882   0.0        0.7165     0.0
      0.07215    -0.01729   0.05537    0.8004     0.04432
      0.04471    -0.01367   0.0        0.5701     0.0
      0.03299    -0.004863  0.0        0.7811     0.0
Mean Period(s): 0.12215299922706335
Standard Dev(s): 0.0870929361325745
srim
Spectral quantities:
       T(s)        ζ        EMACO      MPC       EMACO*MPC
      0.2641     0.09161    0.0        0.7458     0.0
      0.2615     -0.009058  0.0        0.9834     0.0
      0.2371     0.02479    0.469      0.7796     0.3656
      0.2093     0.005807   0.0        0.9137     0.0
      0.1698     0.01461    0.0        0.2895     0.0
      0.1504     0.00437    0.0        0.2727     0.0
Mean Period(s): 0.21538566129203537
Standard Dev(s): 0.043427649128842116
uploads/CE89324/nc73943821_ce89324p.zip
peak acceleration (cm/s/s): 0.14367291582752123
event date/time: 2023-09-30T15:26:00
okid-era
Spectral quantities:
       T(s)        ζ        EMACO      MPC       EMACO*MPC
      0.309      0.04348    0.0205     0.9915     0.02033
      0.236      -0.006437  0.6825     0.9486     0.6474
      0.1778     -0.01251   0.0        0.04636    0.0
      0.03997    -0.004008  0.0        0.6502     0.0
      0.03278    -0.001444  0.0        0.9251     0.0
      0.02253    -0.001517  0.01767    0.3288     0.00581
Mean Period(s): 0.1363546720111275
Standard Dev(s): 0.11137430622464295
srim
Spectral quantities:
       T(s)        ζ        EMACO      MPC       EMACO*MPC
      0.3073     0.002163   0.0        0.8511     0.0
      0.282      0.005495   0.0        0.9829     0.0
      0.2525     0.05413    0.0        0.9987     0.0
      0.2376     -0.02229   0.2042     0.5563     0.1136
      0.2132     -0.008894  0.0        0.8469     0.0
      0.1785     0.007087   0.0        0.649      0.0
Mean Period(s): 0.2451700803591682
Standard Dev(s): 0.04242420292268859
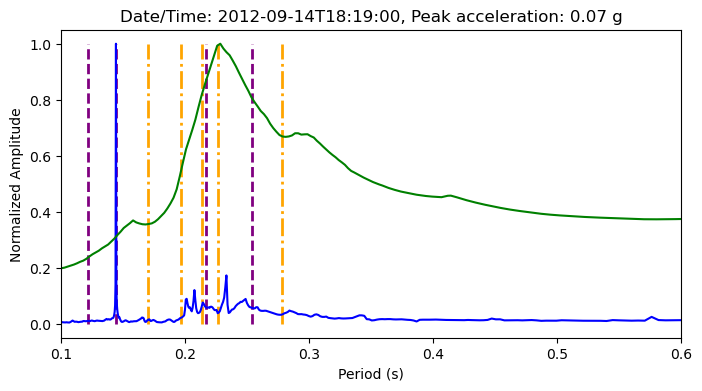
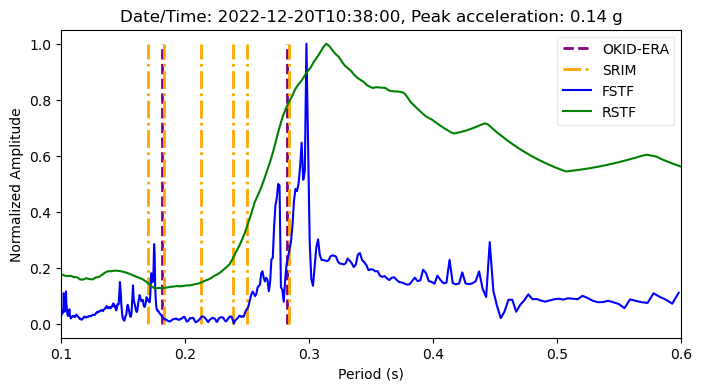
[7]:
import pandas as pd
pd.DataFrame(summary_table).T
[7]:
| peak acc | okid-era | srim | FSTF | RSTF | |
|---|---|---|---|---|---|
| 2012-09-14T11:53:00 | 0.224 | NaN | NaN | 0.252 | 0.241 |
| 2023-09-30T15:26:00 | 0.144 | 0.236 | NaN | 0.170 | 0.251 |
[ ]: